Ayush Saxena

Data analyst · Indore, India · open to remote

I find the number that changes the decision.

I'm a data analyst with 5+ years across analytics, AI and engineering. I work in SQL, Python and Power BI, and I'm doing an MBA in Business Analytics at BITS Pilani. Every project below starts with a business question and ends with what I'd tell the people who own it.

−28%customer acquisition cost for a D2C brand, from cohort and RFM work
1.6% → 2.7%site conversion after A/B tests on the funnel
12–15%less stock imbalance from supply chain models at Tiger Analytics

Projects

Built on public data so anyone can rerun them. Each one has the code, the reasoning behind every cleaning and modelling choice, and the limitations I'd flag to a stakeholder.

Project 1 · SQL

Where does an online retailer's revenue really come from?

  • MySQL 8
  • Window functions
  • CTEs
  • Cohorts
  • RFM

Question: a UK online gift wholesaler has two years of transactions (1M rows). Is it growing, who is it depending on, and where should marketing spend its time?

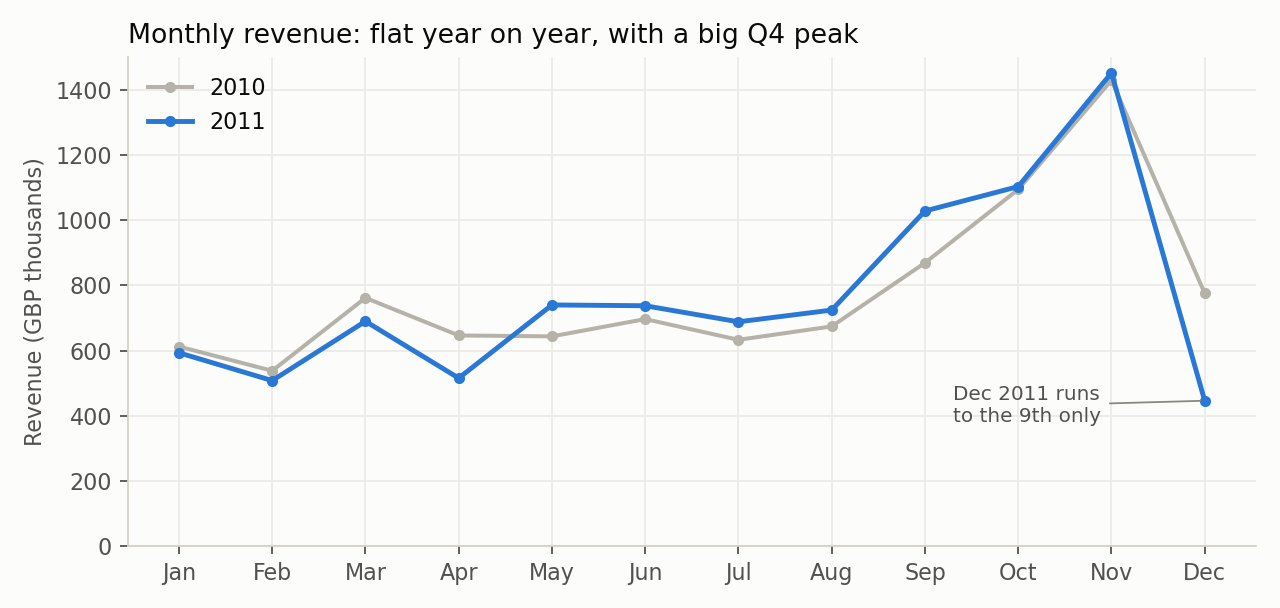
Revenue is flat (+2%) and rests on a shrinking base: the top 10% of customers bring in 63% and first-time customers fell 41% year on year.

  • 349 high-value customers have gone quiet. They spent £1.07M. Winning back one in five is worth about £100k a year.
  • 44% of new customers reorder within 90 days, and 24% never return, so the second order is the moment to act on.
  • Cleaning mattered: two cancelled 75,000-unit orders were entry errors that made random products look like best sellers.
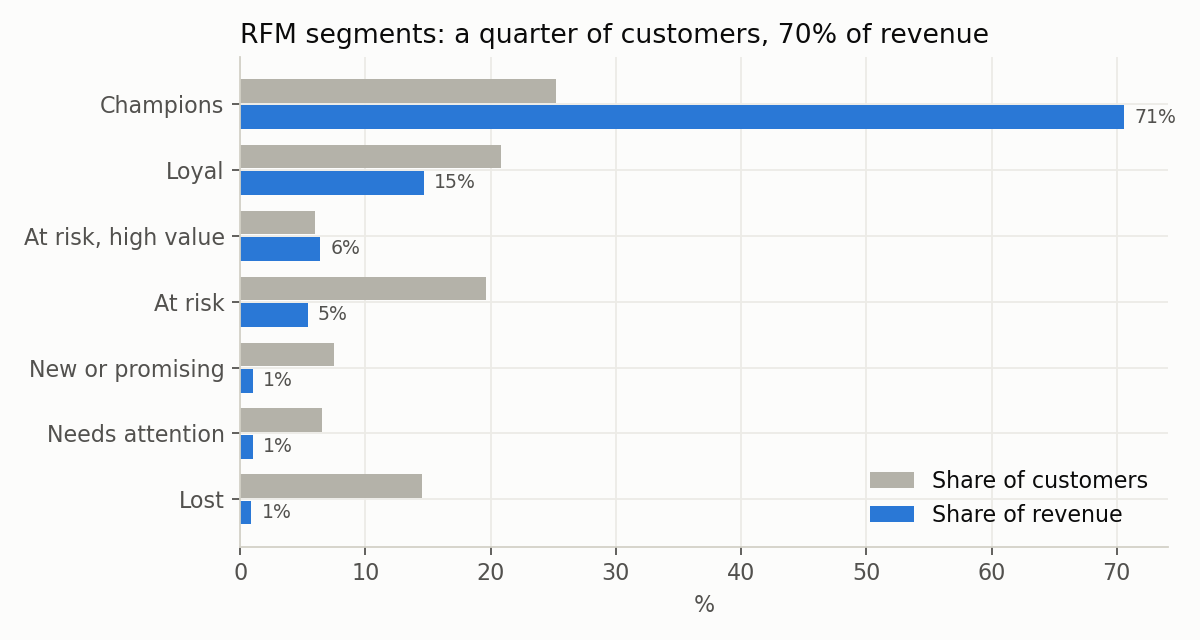
Bar chart comparing each RFM segment's share of customers with its share of revenue. Champions are 25% of customers and about 70% of revenue.
RFM segments scored in SQL with NTILE.

Project 2 · Python

Who should the bank call? Targeting a phone campaign

  • pandas
  • scikit-learn
  • Logistic regression
  • Gains and lift

Question: a bank's campaign converted 11.7% of 45,211 calls. If it can only call part of its list, who goes first and what does it lose?

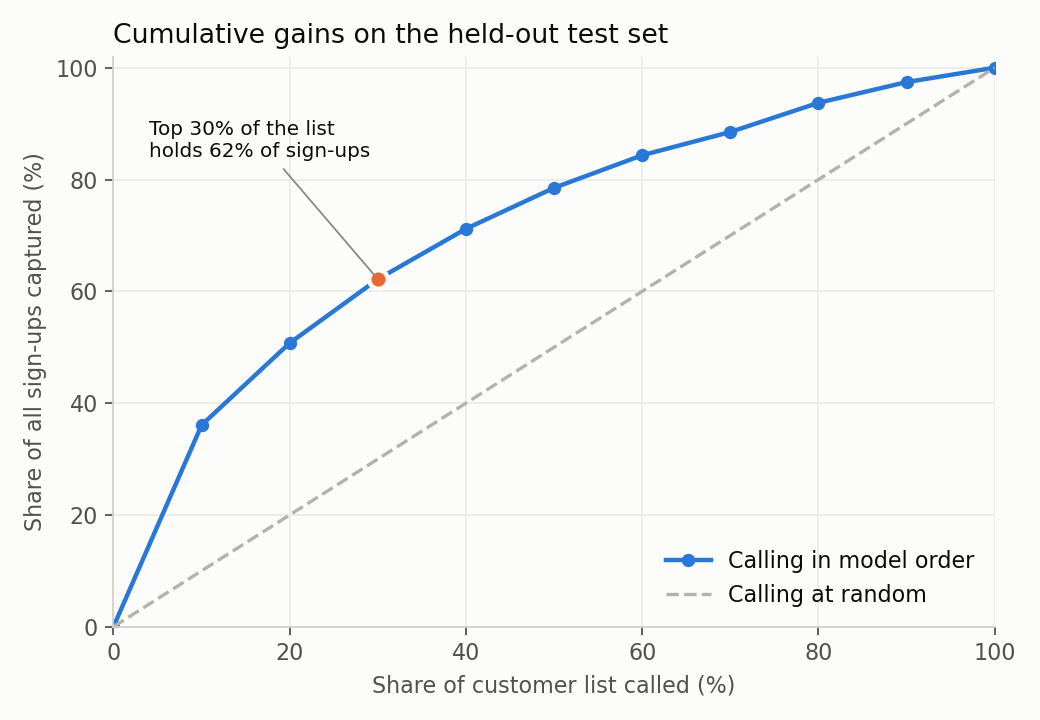
Calling the top half of the list in model order keeps 79% of sign-ups and cuts cost per sign-up from EUR 43 to EUR 27.

  • Top 10% of scores convert at 42%, 3.6 times the average, on a held-out test set (ROC AUC 0.747).
  • Customers called 5+ times took 41% of all calls and gave 7% of sign-ups. I recommend a four-call cap, tested with an A/B split first.
  • I left out call duration because it's only known after the call. Most write-ups of this dataset include it and report inflated accuracy.
Cumulative gains curve. Calling the top 30% of the list by model score captures 62% of sign-ups, against 30% when calling at random.
Cumulative gains on the held-out test set.

Project 3 · Power BI

A retail sales dashboard a manager can open every Monday

  • Power BI
  • DAX
  • Star schema
  • Time intelligence
  • Drill-through

Question: the same retailer's manager needs one place to see revenue against last year, which customers are slipping, and which products get sent back.

  • Star schema with one fact table (1M order lines) and date, customer and product dimensions.
  • Measures for year-on-year revenue, new vs returning customers, and cancellation rate.
  • Figures reconciled against the SQL results from Project 1.
Dashboard in progress
Line chart of monthly revenue in 2010 and 2011. Both years follow the same shape with a peak in November.
Monthly revenue, 2010 vs 2011 (from Project 1).

What I work with

The tools matter less than the questions, but here's the kit.

SQL

MySQL. CTEs, window functions, cohort and funnel queries, data cleaning, query tuning.

Python

pandas, NumPy, scikit-learn, matplotlib. Analysis, automation and classification models.

Power BI and Excel

DAX, Power Query, data modelling. Pivot tables, XLOOKUP and the odd heroic spreadsheet.

Methods

A/B testing, cohort and RFM analysis, segmentation, regression, forecasting basics.

AI in analysis

LLM evaluation since 2023. Using LLMs on customer reviews, and knowing when not to trust them.

Business

MBA in Business Analytics: strategy, economics, predictive analytics, data governance.

Experience

Engineering first, then analytics at scale, then three years tied directly to revenue.

Let's talk

I'm open to remote data analyst, product analyst and BI roles, or hybrid in Indore. The fastest way to reach me is email.